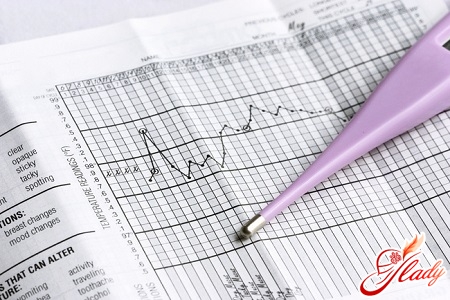
Measuring basal temperature is a favorite folk method today when planning a pregnancy, so it is so important to learn how to correctly draw up a basal temperature (BT) chart.
Why measure BT
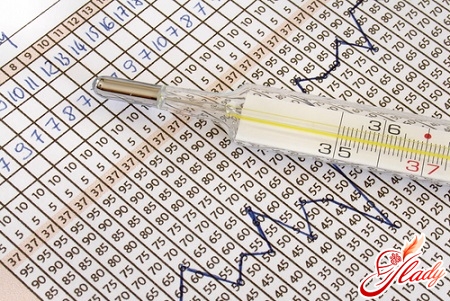
Basal (rectal) - body temperatureafter sleeping for at least 3-6 hours, a person should be at rest. Basal temperature is measured in the mouth, rectum, vagina. Body temperature at this moment is practically independent of external factors. Most women perceive the doctor's requests to measure basal temperature as a formality, but this is not the case at all. Measuring basal temperature is one of the tests for diagnosing ovarian function. Based on the results of its measurement, a graph is plotted, which is subsequently analyzed. It is recommended to measure basal temperature and plot a graph in the following cases:
- With unsuccessful attempts to become pregnant within one year.
- If you suspect a partner or infertility.
- If you suspect a gynecologist you have hormonal disorders
- If you want to increase the chances of getting pregnant.
- In experiments with methods of floor planning.
By measuring your basal body temperature you can find out:
- The time of egg maturation (determine the day of ovulation with a view to protecting or, conversely, the best opportunity to become pregnant);
- To determine the quality of the endocrine system;
- Prevent possible gynecological problems, for example, endometritis;
- Identify the boundaries of the menstrual cycle;
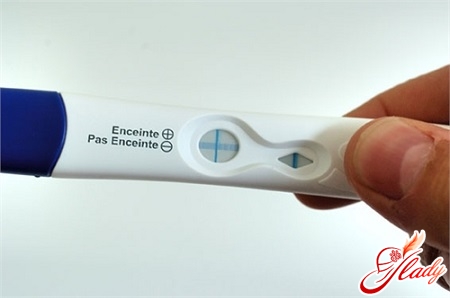
- Determine the onset of pregnancy with a delay in menstruation;
- Assess whether the ovaries produce hormones in different phases of the cycle.
Correct chart for measuring basaltemperature can show not only the presence of ovulation but also its absence, and indicate disorders in the endocrine and reproductive systems. Basal temperature measurements should be taken for at least 3 cycles to ensure accurate information that will allow you to predict the date of ovulation and determine the most favorable time for conception. To measure basal temperature, you will need a regular medical thermometer (mercury or electronic). Prepare the thermometer the night before and place it next to your bed.
How to measure basal temperature

What does BT depend on?
The body's BT changes during the cyclethe influence of hormones. During the maturation of the egg, the level of estrogens increases (the initial phase of the cycle, hypothermic), BT is low, on the eve of ovulation the temperature drops to a minimum and then rises again, becoming maximum. At this time, ovulation occurs. The temperature after ovulation becomes high, which is due to a decrease in the level of estrogens and an increase in the level of progesterone. Pregnancy, due to the influence of progesterone, also occurs at an elevated temperature. The difference between the low and high temperature phases is 0.4-0.8 °. Only with a particularly accurate measurement of BT is it possible to record all phases of the cycle. During menstruation, the values are usually around 37 ° C, during follicle maturation no more than 37 ° C, immediately before ovulation the values decrease, and the basal temperature after ovulation is slightly increased - up to 37.1 ° C. Until the next period, BT is elevated and decreases slightly by the beginning of menstruation. If the BT indicator of the first phase is higher than in the second, this may indicate an insufficient amount of the hormone estrogen, medications will be required to correct this. If the BT of the second phase is lower than the first, we can conclude that the level of progesterone is low, which also requires correction of the hormonal background. A stable two-phase cycle indicates ovulation that has occurred. This is the norm for healthy ovaries. By making a BT chart, you can not only find out when ovulation occurs, but also determine the processes occurring in your body. If the chart is constructed correctly, then it can not only determine ovulation by basal temperature, but also identify certain diseases.
Definition of ovulation
Speaking about the onset of ovulation, it is necessary to list the WHO rules:
- 3 temperature values in a row should be above the line level, which is drawn from above the six preceding temperature values.
- The difference between the three temperature values and the middle line should be at least 0.1 degrees in two days out of three and not less than 0.2 degrees on one of the specified days.
It happens that it is not always possible to determineovulation by this method due to the presence of high temperatures in the initial phase of the cycle. Then, when analyzing the basal temperature chart, use the "finger rule": exclude values that differ from the previous or subsequent ones by more than 0.2 degrees. These values should not be taken into account if the BT chart as a whole corresponds to the norm. The most optimal time for conception is the day of ovulation itself and two days before it occurs. In general, a cycle length of 21-35 days is considered normal. If your cycle differs from these values, then ovarian dysfunction is possible, which often causes infertility.
Length of the second phase
The graph of the basal temperature can be divided into2 фазы. Деление отмечается в месте проставления линии овуляции (она вертикальная). Продолжительность второй фазы составляет 12-16 дней в норме, чаще 14 дней. Продолжительность первой фазы сильно варьируется, это зависит от индивидуальных особенностей организма женщины. В то же время общая продолжительность цикла изменяется лишь из-за продолжительности первой фазы. Пример частой проблемы, выявляемой на графиках и подтверждаемой последующими исследованиями, — недостаточность второй фазы. Если при наблюдении в течение нескольких менструальных циклов за тем, какая базальная температура, вы отметили, что вторая фаза менее 10 дней, необходимо проконсультироваться у гинеколога. Нормальный график представляет собой разницу температур 1 и 2 фазы не больше 0,4 градуса. Если это не так, могут наблюдаться гормональные проблемы. Стоит сделать анализ на эстроген и прогестерон. Пример графика при эстроген-прогестероновой недостаточности Имеется небольшой подъем показателей во 2 фазе. Разница показателей 1 и 2 фазы не больше 0,2-0,3°. БТ начинает подниматься только незадолго до менструации, при этом предменструальное понижение отсутствует. 2 фаза может продолжаться не меньше 10 дней. Такой график не норма, это может свидетельствовать о невынашиваемости. На таком графике не будет характерной базальной температуры при овуляции, речь может идти в таком случае об ановуляторном цикле. У любой женщины может возникать время от времени ановуляторный цикл, но он не должен повторяться несколько раз подряд. Без овуляции невозможно забеременеть. Пример графика при эстрогенной недостаточности Это беспорядочная температурная линия, отмечаются значительные размахи показателей, в таком случае обязательно требуется сдача анализов крови на гормоны и проведение исследования УЗИ. При необходимости назначаются лекарственные препараты. Пример графика при недостаточности эстрогенов В 1 фазе в организме женщины превалирует гормон эстроген. Под его влиянием БТ до наступления овуляции держится ив рамках 36,2-36,5°. Если показатели в 1 фазе повышаются и держатся выше этих значений, предполагают недостаточность эстрогенов. Тогда средние показатели 1 фазы повышаются до 36,5-36,8° и держатся на этом уровне. Для исправления ситуации прописывают гормональные препараты. Пример графика с воспалением придатков Еще одной причиной повышения температурных значений в 1 фазе может стать воспаление придатков. Тогда показатели повышается только до 37° на пару дней в 1 фазе, а потом вновь падают. При таком графике затруднительно рассчитать овуляцию. Базальная температура при овуляции может быть замаскирована повышением из-за воспалительного процесса. Это пример того, почему важно определять показатели БТ на протяжении всего цикла. Пример графика при эндометрите В норме температурные показатели в 1 фазе снижаются в процессе менструального кровотечения. Если показатели в конце цикла падают до наступления месячных и вновь поднимаются до 37° при начале менструации, это свидетельствует, скорее всего, об эндометрите. Характерно снижение температурных значений перед менструацией и повышение с началом нового цикла. Пример графика при недостаточности желтого тела Во 2 фазе в организме вырабатывается прогестерон. Он отвечает за подъем температуры во 2 фазе и препятствует наступлению месячных. При недостатке его температурные показатели поднимаются медленно, и беременность в этом случае может быть под угрозой. Температура тела поднимается перед месячными, предменструального спада нет. Но диагноз все же ставится на основании анализа на прогестерон, взятый во 2 фазе. Пример графика при эстроген-прогестероновой недостаточности В случае сочетания низкой температуры во 2 фазе и слабовыраженного повышения показателей (0,2-0,3°С) после наступления овуляции можно увидеть пример недостаточности двух гормонов. Пример графика при гиперпролактинемии Из-за повышения гормона пролактина, который отвечает за поддержание лактации и беременности, график БТ может быть схож с графиком беременной женщины. Месячные также могут отсутствовать. Признаки возможного бесплодия, которые можно определить по графику БТ:
- The average value of 2 phases is greater than the average value of 1 phase by less than 0.4 °. In the 2nd phase of the cycle there are drops in temperature values (below 37 °).
- The increase in values in the middle of the menstrual cycle is longer than 3-4 days.
- Phase 2 is less than 8 days.
How to determine pregnancy by BT
Determining pregnancy using this method is possibleonly if ovulation occurs. It is worth reminding once again about the fluctuation of body temperature during ovulation: before its occurrence, BT is low (up to 37°), before ovulation, BT decreases, and immediately after its occurrence, it rises by 0.4-0.5°. If BT after the jump (basal temperature during ovulation) continues to remain elevated for more than 14 days, this indicates the onset of pregnancy. In case of pregnancy, menstruation does not occur, and temperature indicators remain elevated throughout pregnancy. A decrease in BT during pregnancy may indicate a lack of hormones that are responsible for maintaining pregnancy, which may cause a threat of its termination. It is impossible to make any diagnosis based only on BT charts; the final diagnosis is made based on examinations conducted by a gynecologist.


